How benchmarks compare your results
Benchmarks rate each result against your own earlier periods. How the ratings work, and why there is no comparison with other brands.
About 2 minutes to read
What you are compared with
Every result on Analytics then Benchmarks is compared with your own history: the same measure over your earlier periods of the same length. The middle value of those periods, the median, is the line each result is rated against. Each period’s rate comes from its summed counts.
- Last month
- The six months before it.
- Last quarter
- The four quarters before it.
- Last 12 months
- The two 12-month stretches before it.
- Year to date
- The same stretch of the two years before.
- Last year
- The two years before it.
- Custom range
- The four periods of the same length just before it.
A result needs at least two earlier periods with data to be rated. Until then it says Not enough history.
What the ratings mean
- Excellent
- A tenth or more better than your median.
- Good
- Within a tenth of your median, either way.
- Fair
- Up to a third worse than your median.
- Poor
- More than a third worse.
For bounce, spam complaint and unsubscribe rates, lower is better, so “better” means lower.
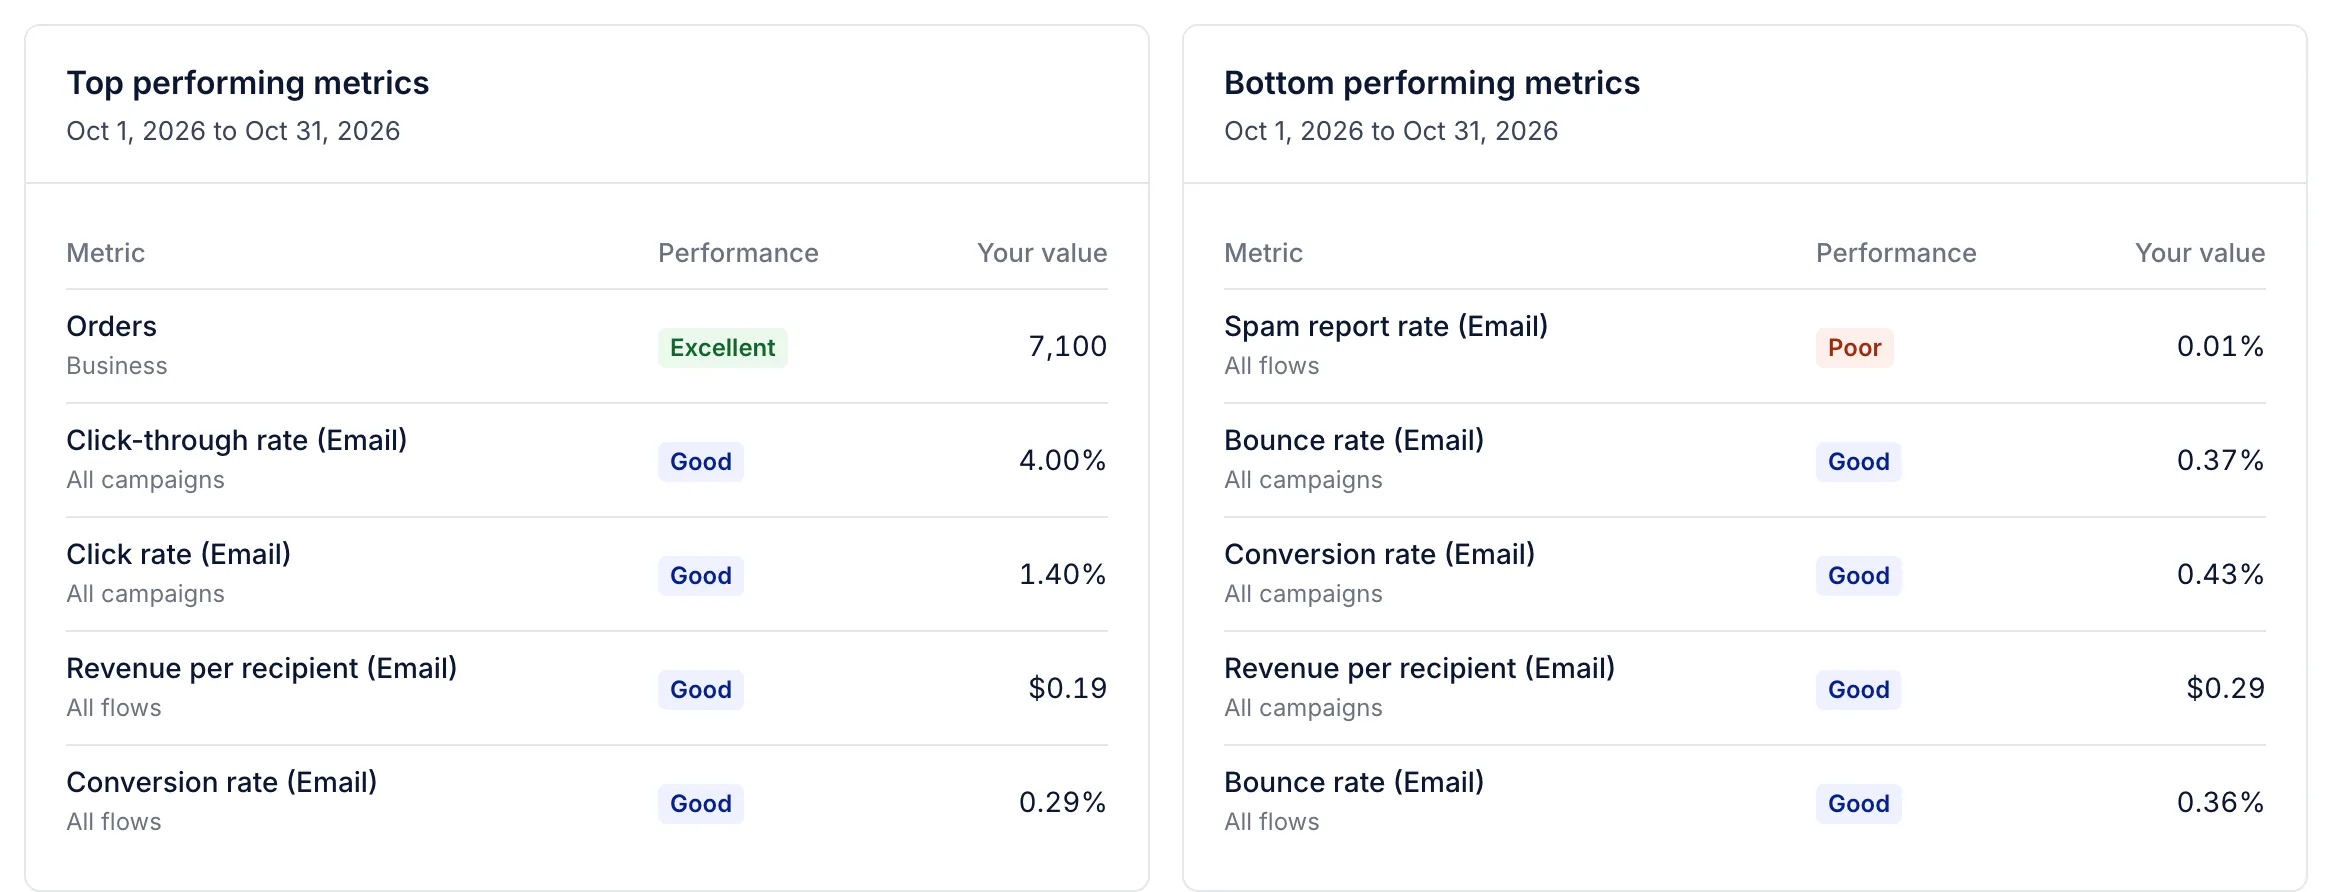
A rating is relative. A spam complaint rate of 0.01% can be rated Poor when your usual rate is lower still. To judge a rate against fixed limits, use the deliverability score.
The tabs
- Overview
- Your five best and five worst results across campaigns, flows and business measures.
- Business performance
- Orders, average order value, average order count (orders per customer), average cart size (items per order) and the share of orders returned.
- Campaigns
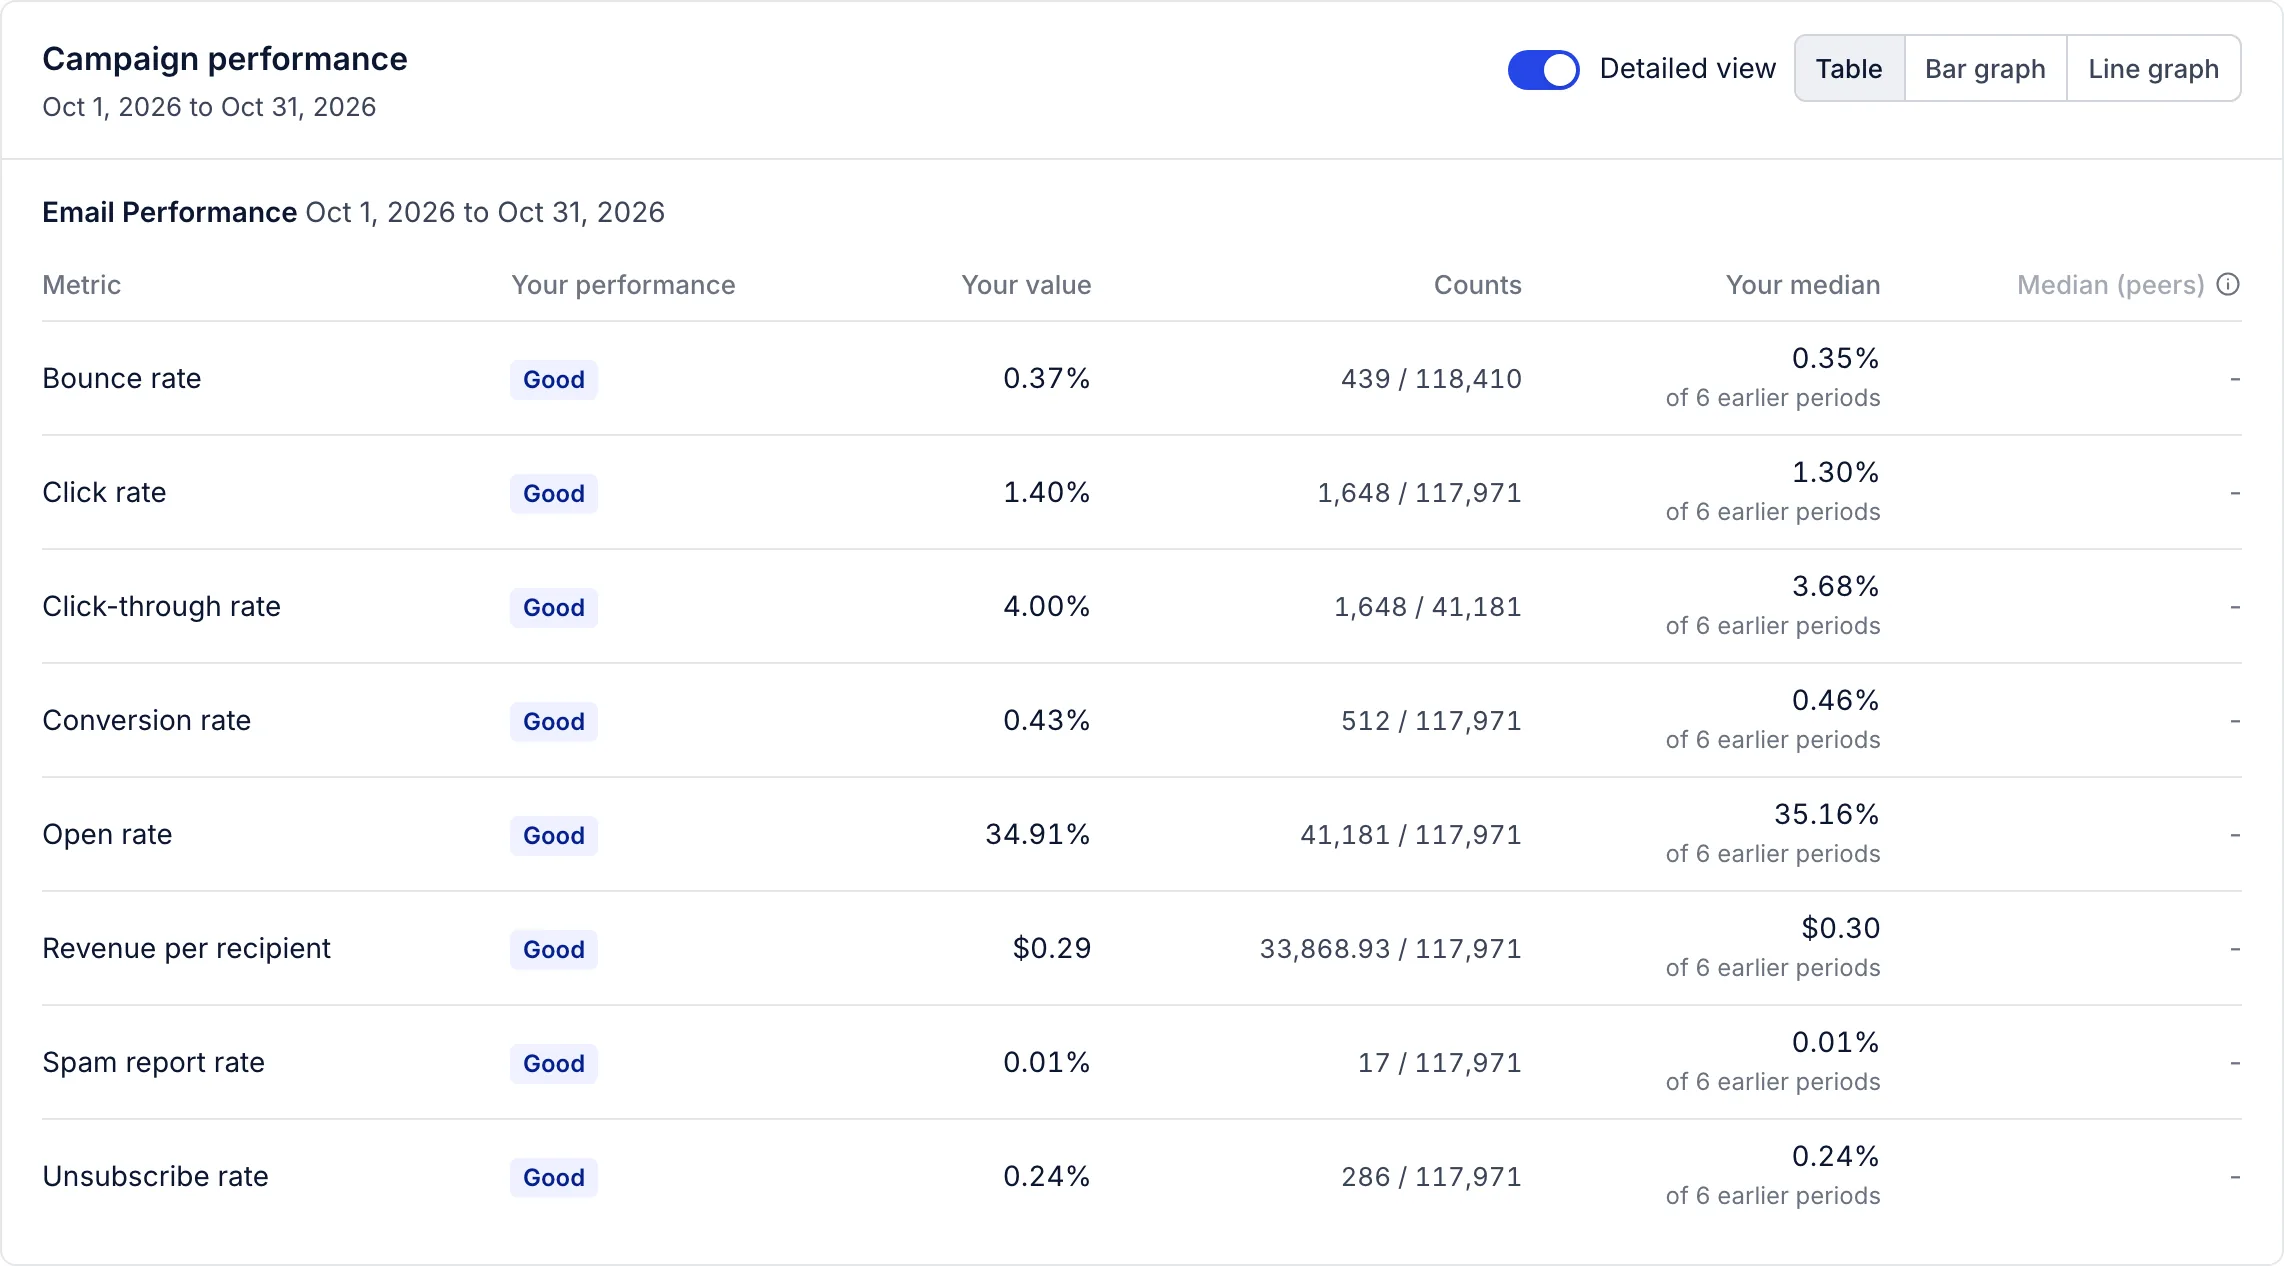
- Email rates for all your campaigns: open, click, click-through, conversion, bounce, spam report and unsubscribe rates, and revenue per recipient.
- Flows
- The same rates for all flows, or for the flow you choose.
- Sign-up forms
- The submit rate for all forms, or for one form.
Turn on Detailed view to see the counts behind each rate and how many earlier periods the median used. Switch to a bar or line chart, or choose Export for a CSV.
Why there is no peer comparison
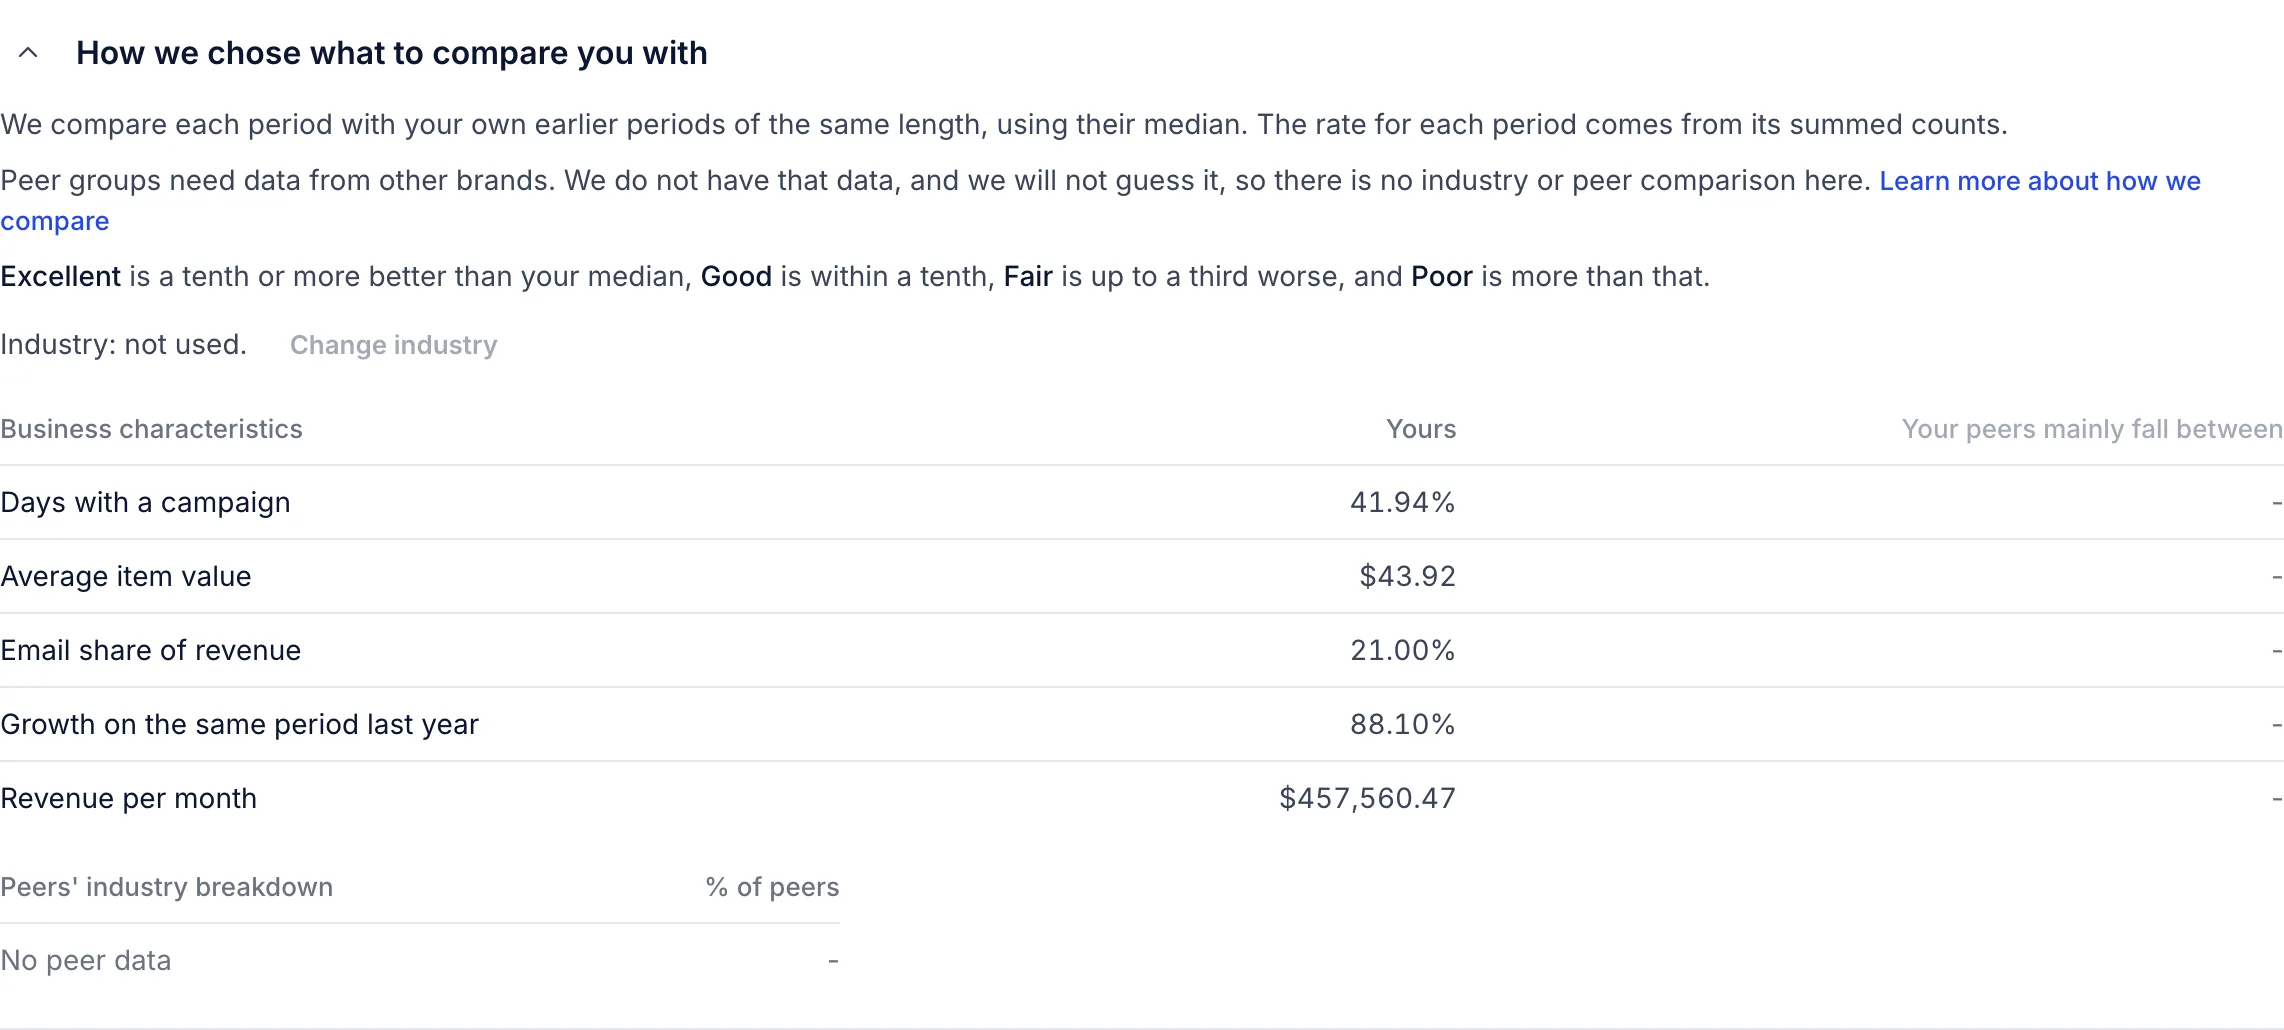
Comparing you with similar brands needs their numbers. We do not have that data, and we will not estimate it, so the peer columns stay empty and the industry cannot be changed. The table of your own business characteristics, such as revenue per month and email’s share of revenue, is still there to read.
Text message benchmarks appear once your account has sent texts.
Related articles
- Your deliverability score
What the score out of 100 is made of, the ranges we recommend, and the quickest ways to raise it.
- Custom report types
The five kinds of custom report, what each one answers, and how to run, schedule and export one.
- Holdout tests
Keep a share of your profiles out of marketing for a while, and compare what they buy with everyone else, to see what your email and texts add.
Something wrong or missing? Email hello@growthdept.ai.