Custom report types
The five kinds of custom report, what each one answers, and how to run, schedule and export one.
About 3 minutes to read
Start a report
- Go to Analytics then Custom reports and choose Create from scratch, or pick a ready-made one from Reports Library.
- Choose a Report Type and give the report a name.
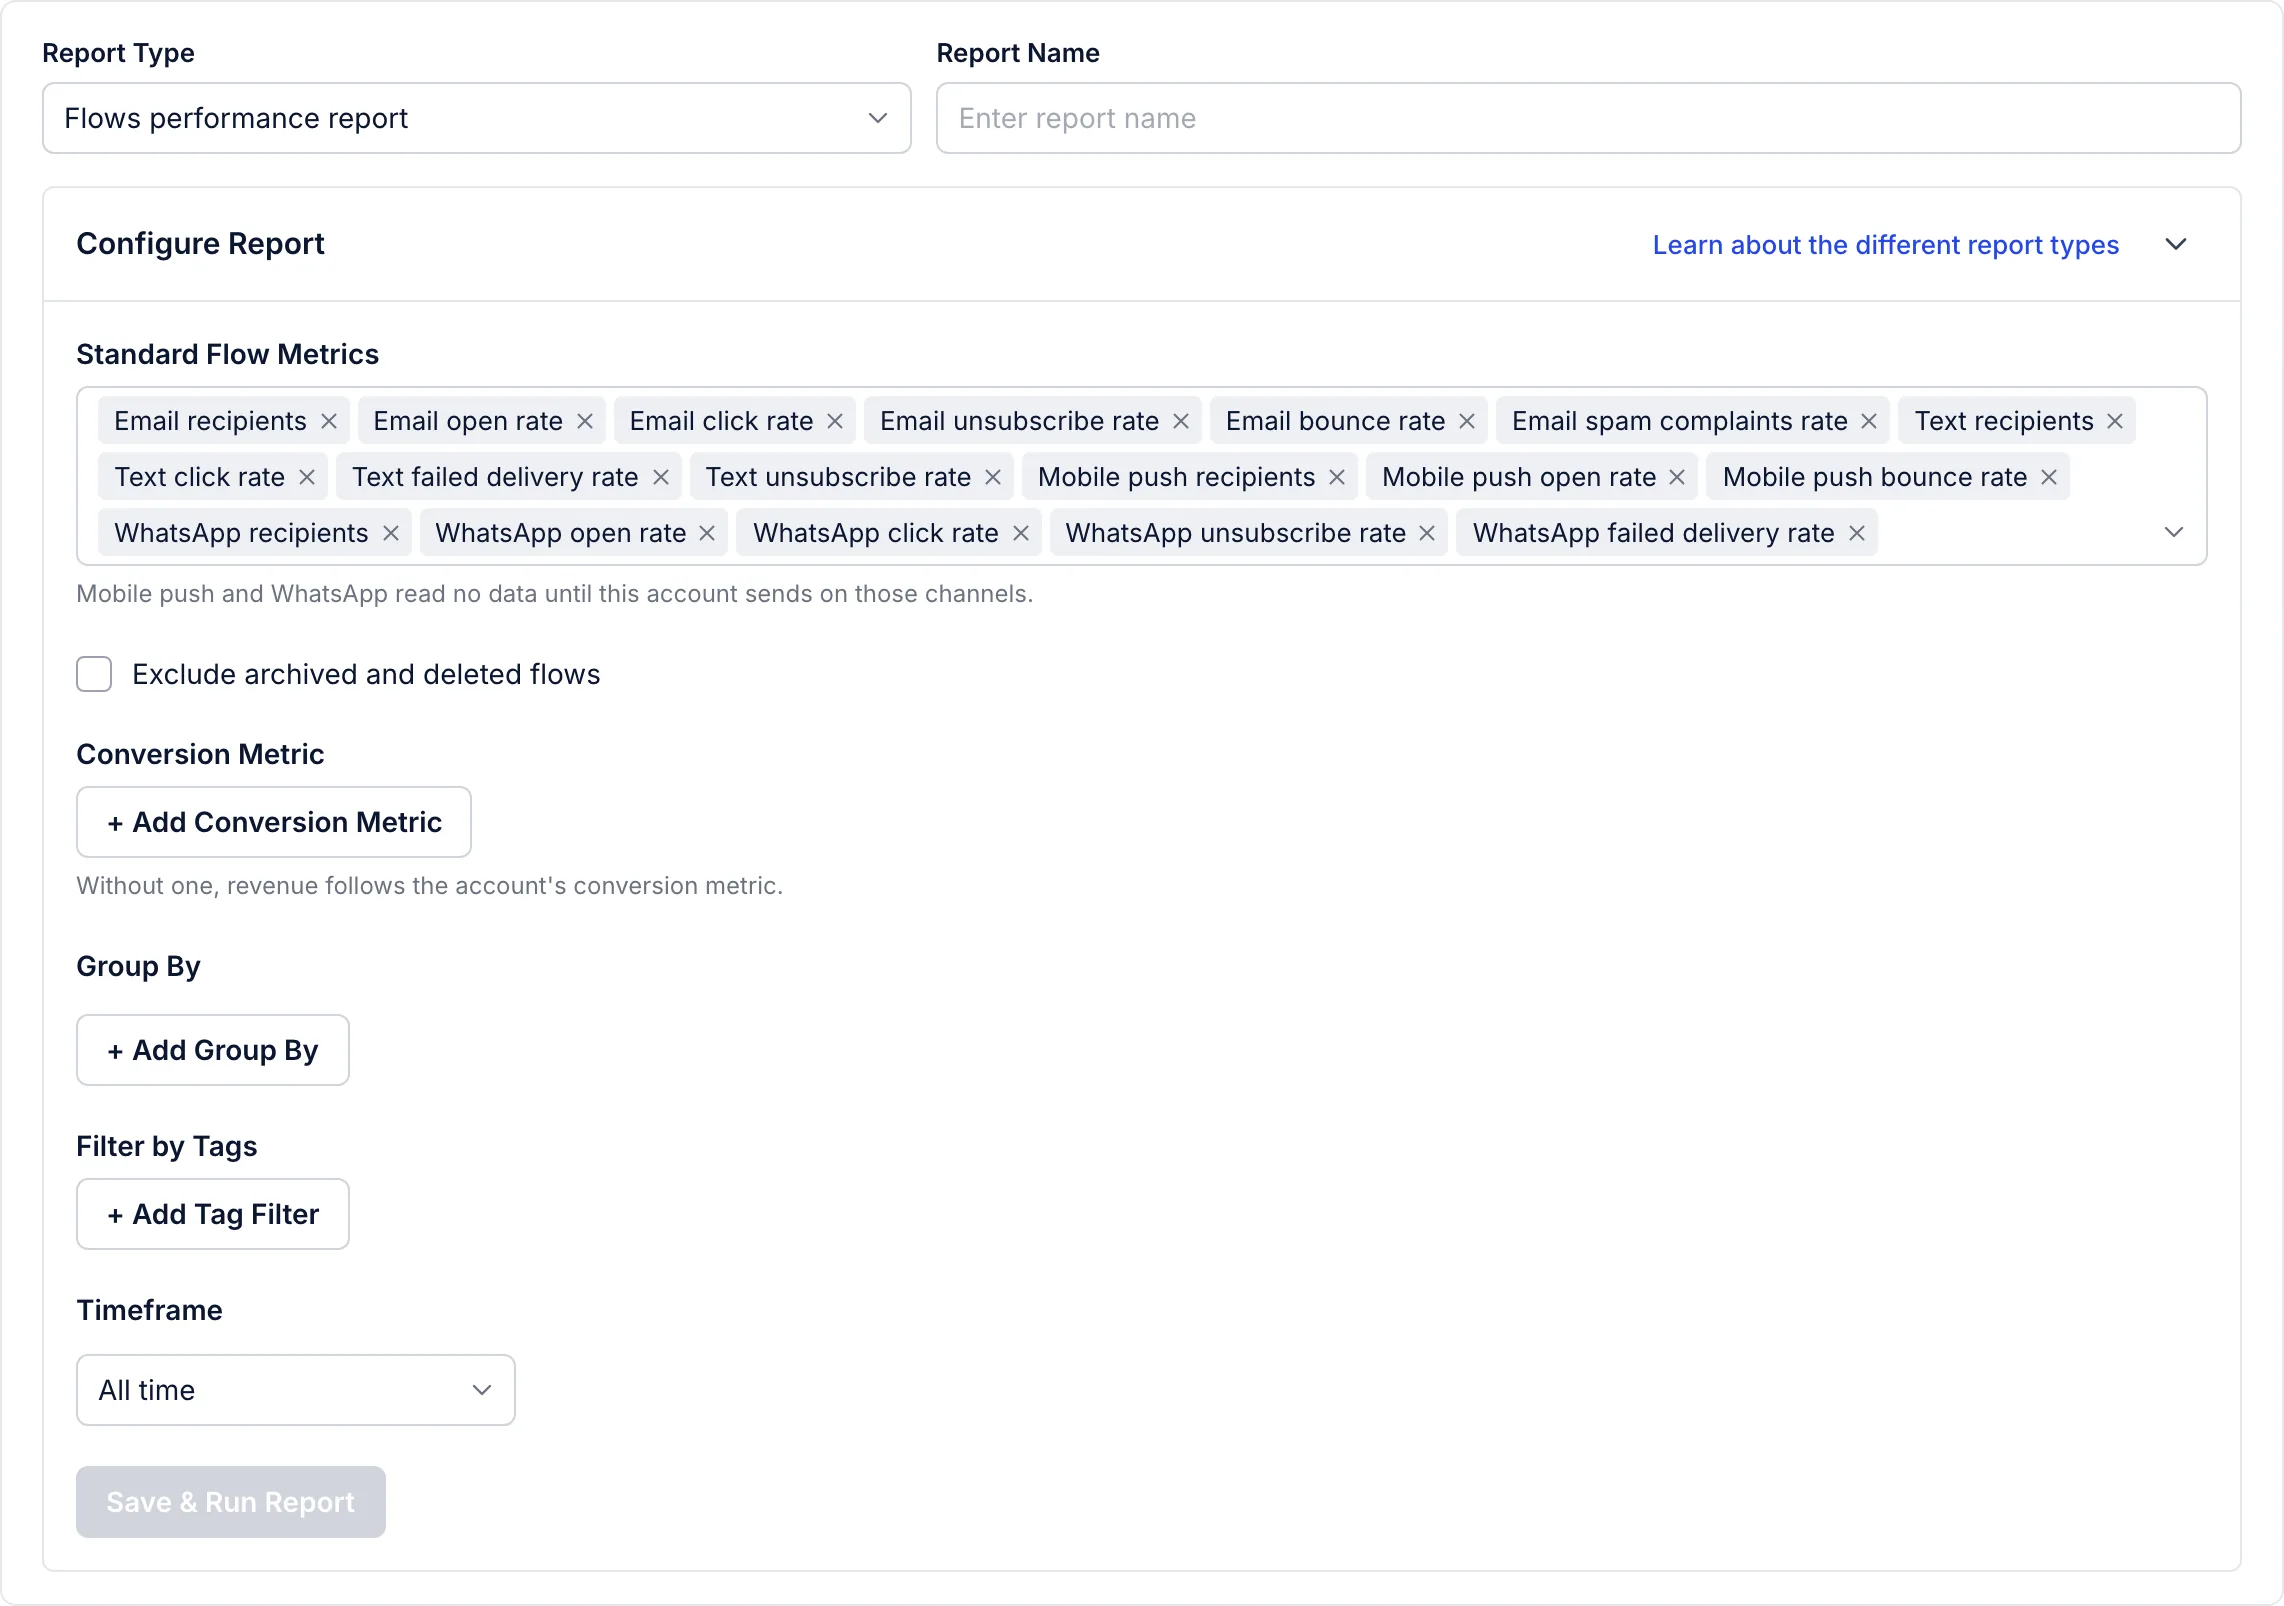
- Under Configure Report, choose what to measure. The options change with the type.
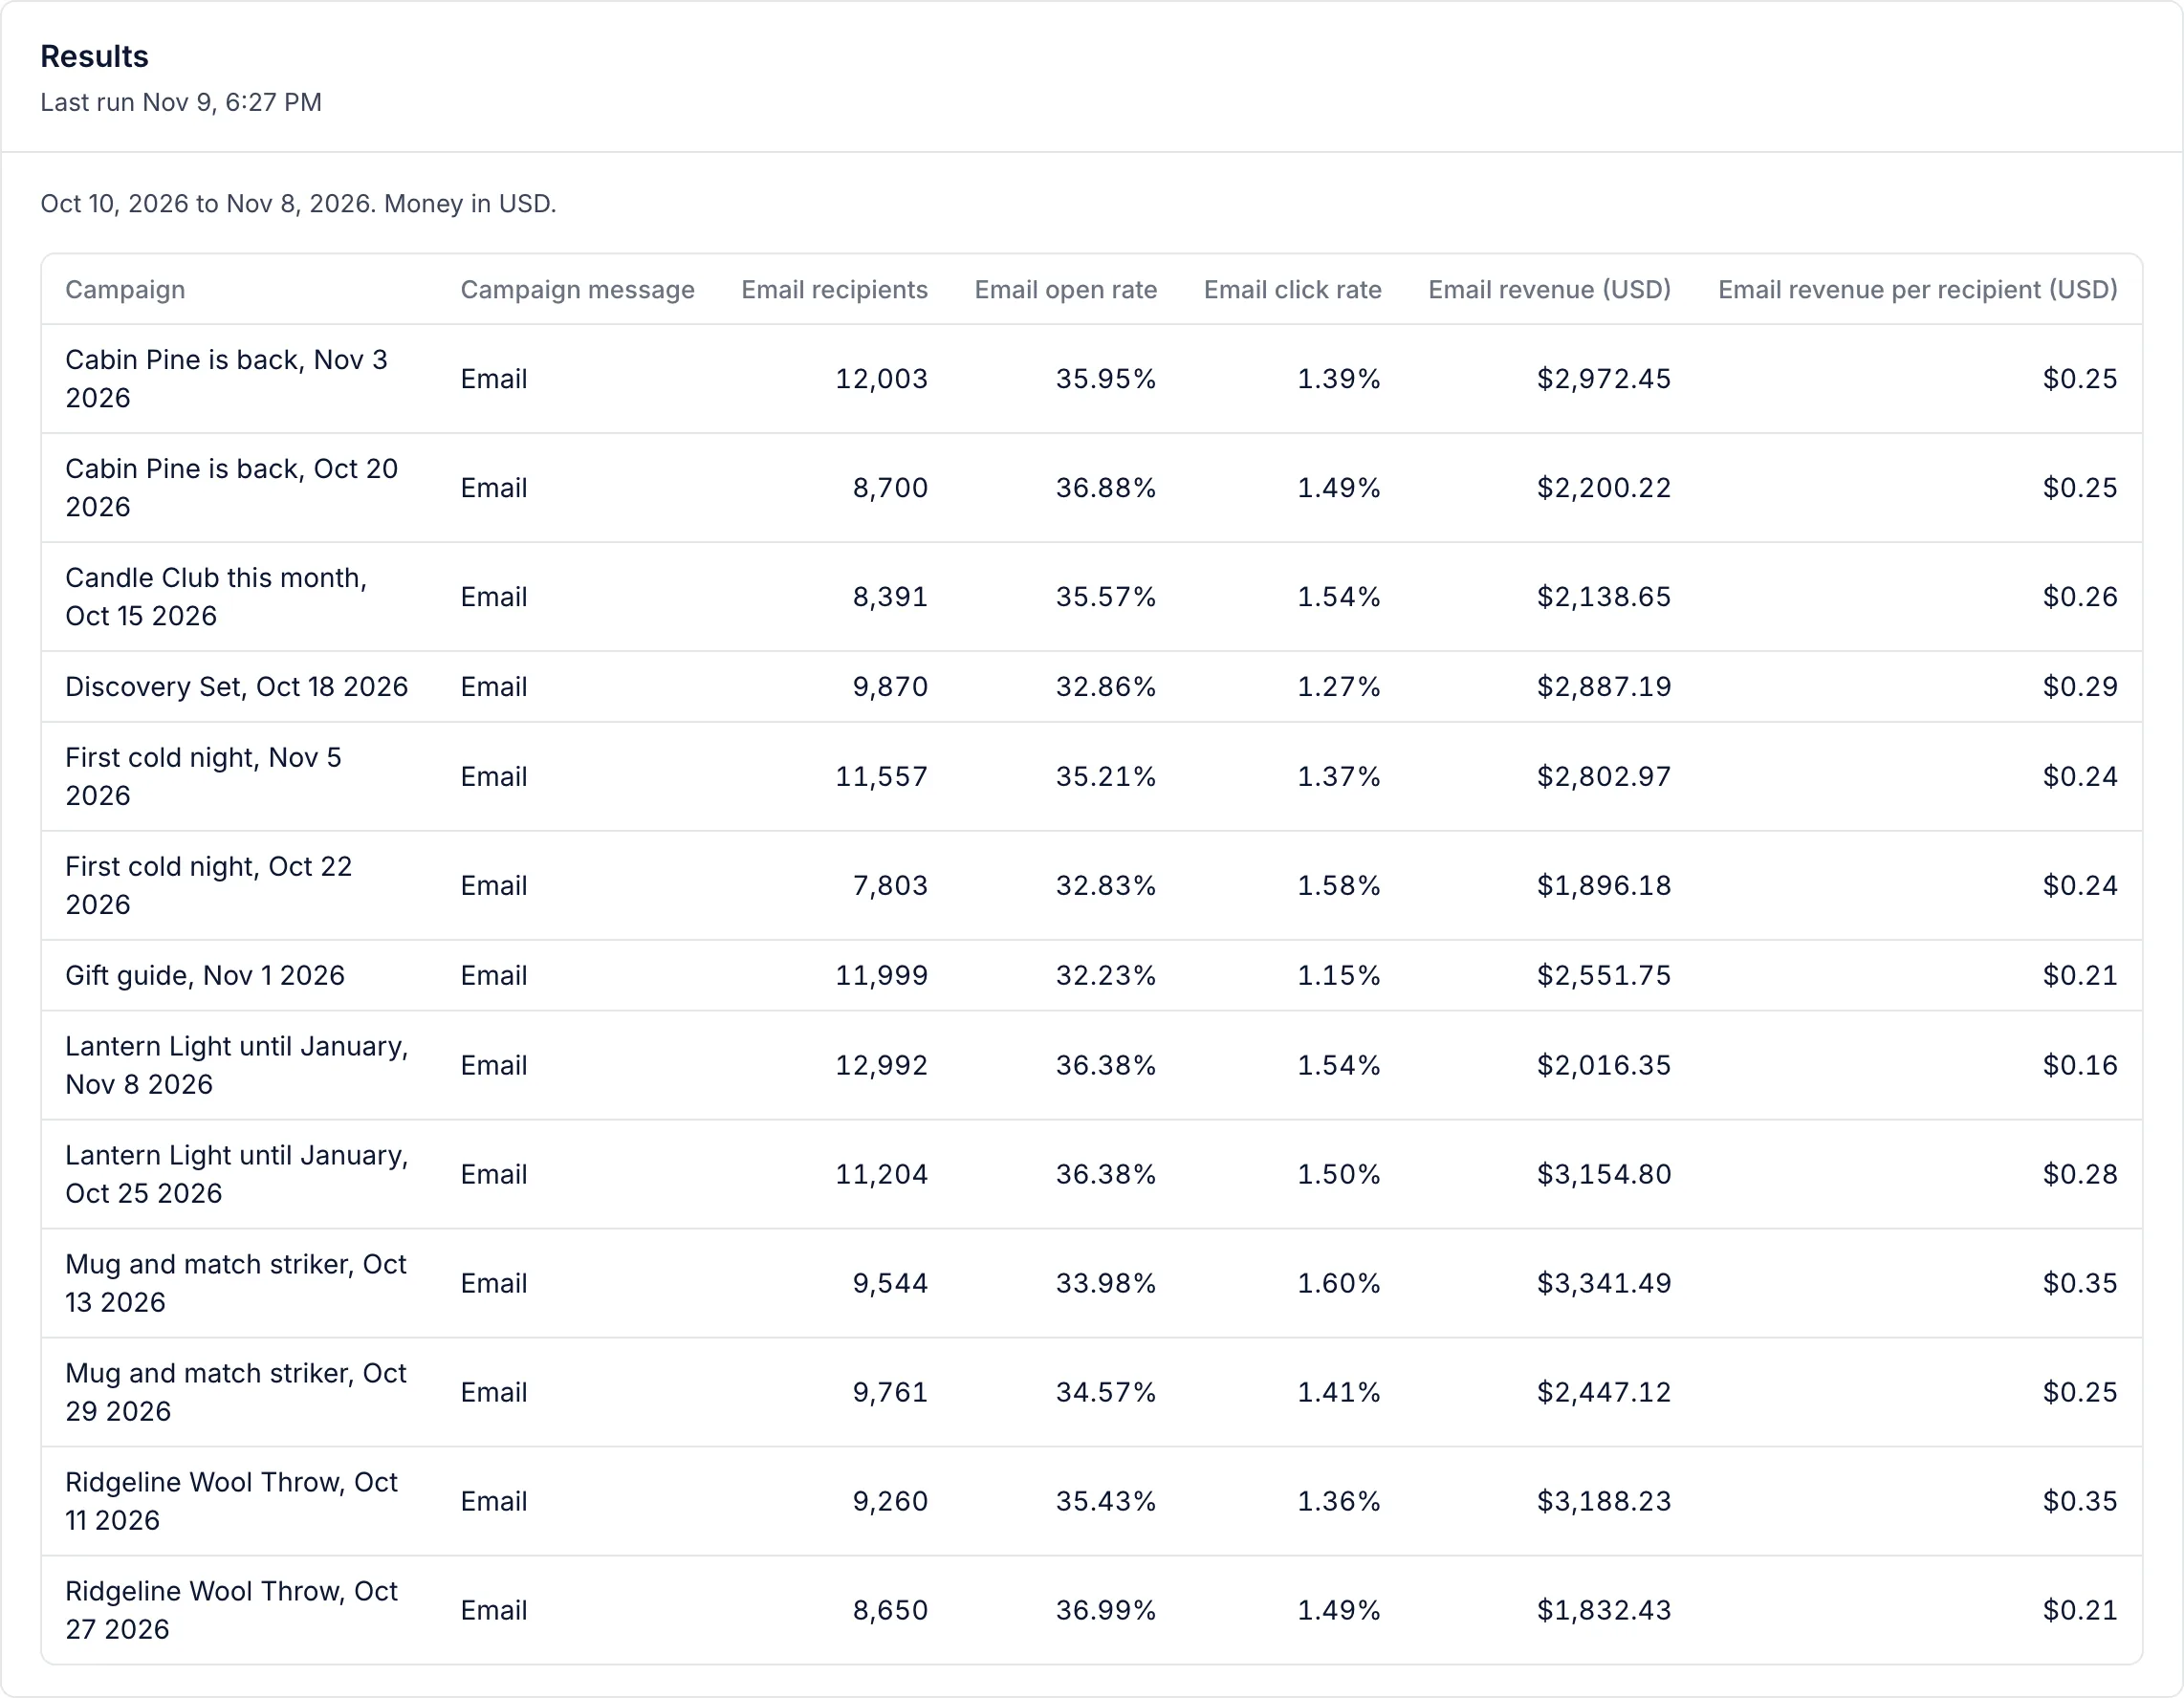
- Choose Save & Run Report. The results show under the form, and every run is kept, so you can see last week’s numbers next to this week’s.
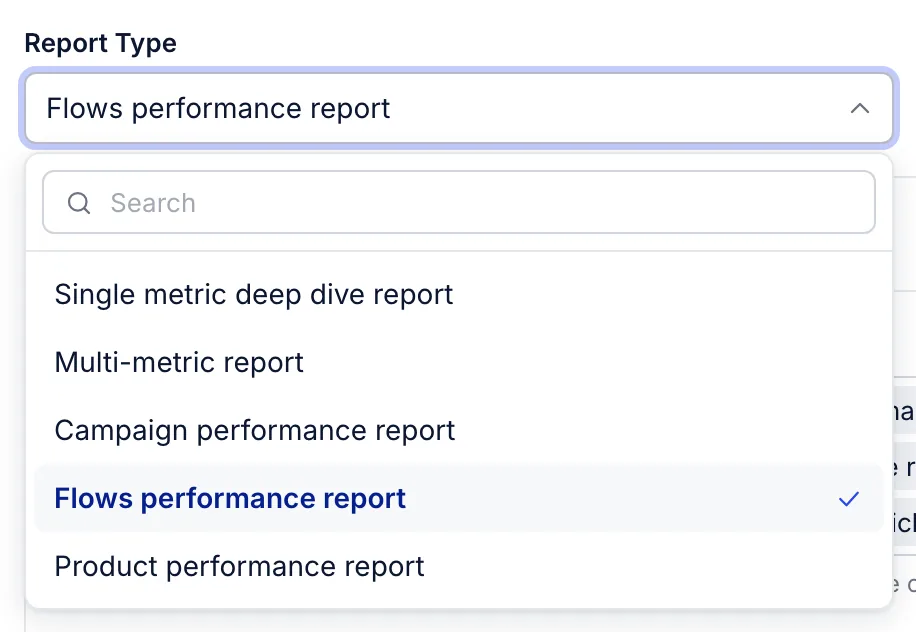
Which type to choose
- Single metric deep dive
- One metric, such as Placed Order or Viewed Product, as a count, as unique people, or as value. Split it by one of the event's properties and filter on up to five. For questions like "how many orders used each discount code last month?"
- Multi-metric
- Up to ten metrics side by side, over the same dates, split and filters. For comparing things that happen in the same period, such as checkouts started against orders placed.
- Campaign performance
- Delivery, engagement and revenue for your campaigns, per channel or across every channel. Group the rows by campaign message, variation, list or segment, inbox provider or message format, up to three at once, and filter by tag.
- Flows performance
- The same measures for flows. Group by flow, flow message, variation, channel or message format.
- Product performance
- Ordered Product, or another metric you choose, by product name, brand or category, with up to five more metrics as extra columns. Shows which products sell, and to how many people.
Count, unique and value
The metric reports measure each metric one of three ways:
- Total
- Every time the event happened.
- Unique
- How many people it happened to. Someone who ordered three times counts once.
- Value
- The money the events carried, in your account's currency. Value can also be shown as the average, the smallest or the largest instead of the sum. Counts always add up, so that choice applies to value only.
Tick Leave out rows where every value is zero to keep a long split readable.
Dates and breakdowns
Every report has a timeframe: presets from today to the last 365 days, all time, or your own dates. Campaign and flow reports count messages by when they were sent, so their choices read “Sent last 30 days”, and a campaign report can cover every campaign you have sent.
Break the rows down by day, week or month to see a trend. Over all time, rows go by month, so a report never runs to thousands of rows.
How the numbers are worked out
- Rates come from summed counts. An open rate for ten campaigns is all their opens over all their deliveries, never an average of ten rates.
- A channel that sent nothing in a row shows no data rather than zero. Mobile push and WhatsApp read no data until your account sends on those channels.
- Revenue follows your account’s conversion metric and attribution settings, unless you add a conversion metric to the report.
- Grouping by inbox provider reads the domain of each address we sent to: Gmail, Yahoo and AOL, Microsoft, Apple iCloud, and other providers. History imported from another platform has no addresses, so it is not in those rows.
Schedule and export
Choose Schedule to email a report daily, weekly on a day you pick, or monthly on a day from the 1st to the 28th, at an hour in your account’s time zone. It goes to the people you choose from your organization. The email holds the first 50 rows; the report in the app has the rest.
Once a report has run, Export CSV downloads that run. Money columns carry the currency in their heading.
Related articles
- How benchmarks compare your results
Benchmarks rate each result against your own earlier periods. How the ratings work, and why there is no comparison with other brands.
- Your deliverability score
What the score out of 100 is made of, the ranges we recommend, and the quickest ways to raise it.
- Holdout tests
Keep a share of your profiles out of marketing for a while, and compare what they buy with everyone else, to see what your email and texts add.
Something wrong or missing? Email hello@growthdept.ai.